
The 2011 GNOME User Survey Results
Here are the much-anticipated results of the 2011 GNOME User Survey.
As mentioned when announcing the survey, several months ago I was contacted about hosting the 2011 GNOME User Survey after the GNOME Foundation itself wasn't interested in collecting the feedback from their users. The survey ran for October and November on Phoronix, and now I have finally had time to dump the results and look.
Before getting started with these results from the survey, over the past several weeks I have posted the thousands of comments generated from this survey, you can find them here: part 1, part 2, part 3, part 4, part 5, and part 6.
In total there was 9807 responses to the 2011 GNOME User Survey.
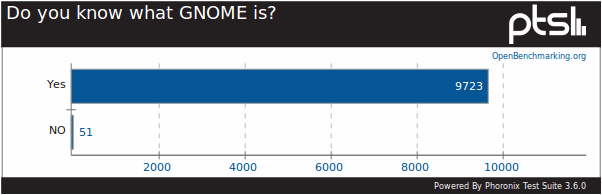
In getting started, the first question was whether the survey respondent knew what GNOME was... Fortunately, most everyone was familiar with the GNOME desktop.

In terms of which desktop environment / OS their desktop most resembled, most of the users selected GNOME 2 followed by GNOME 3. Interestingly, there were less than 500 of the nearly 10,000 respondents who chose KDE as their desktop. The numbers for KDE and Unity were quite close.

About half of the respondents are mostly satisfied with GNOME.