
A Batch Of Graphics Cards On Gallium3D
Yesterday the results for the Intel Core i5 2500K graphics on Linux were finally published after receiving a new motherboard and CPU from Intel that did not encounter the earlier Sandy Bridge problems. That article included results for several ATI Radeon graphics cards using both the proprietary Catalyst driver as well as AMD's open-source Gallium3D driver, there was also the testing done from a NVIDIA GPU under the reverse-engineered Nouveau driver that's also written against the Gallium3D architecture. In this article is an even larger round up of graphics cards being tested under open-source Gallium3D drivers. There are also results from the Gallium3D-based LLVMpipe driver.
Immediately when finishing the tests for yesterday's article, testing was continued under the same configuration using more graphics cards. This was done internally for testing against the OpenBenchmarking.org Performance Classifications (OPC) support. This feature was alluded to at the end of the Core i5 2500K Linux article as being one of the Phoronix Test Suite 3.0-Iveland and OpenBenchmarking.org features. Later on it ended up being said in the forums what this is all about after users began speculating.
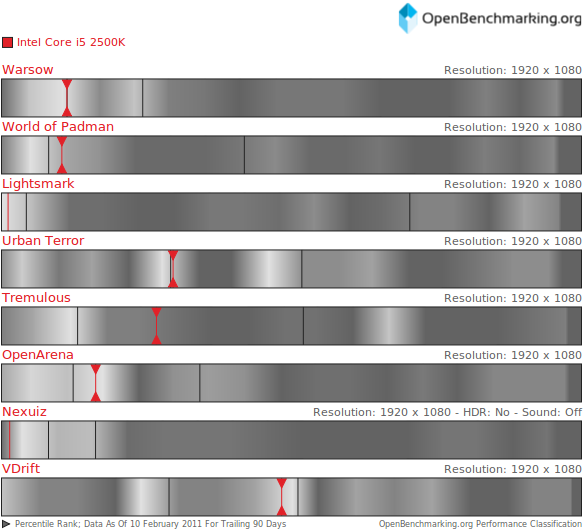
This 1D (yes, there's a 2D version to be worked on as well) "heat-map" represents the spectrum of every test result stored on OpenBenchmarking.org for that particular test profile with matching test parameters (same test profile version, same resolution / client settings, etc). What this means right now is representative from dozens to hundreds of matches, as OpenBenchmarking.org data is from those testing development versions of 3.0-Iveland, but soon as Phoronix Test Suite 3.0 is released in two weeks this number should be into the thousands by this time next month.
These heat-maps are generated with the trailing data from the past several months and are being routinely updated as to include the most relevant results for the hardware actually being used around that time. This data is available for any test profile, whether the test was created by Phoronix Media or was done by some third party and then updated to OpenBenchmarking.org. Not only that -- but like all OpenBenchmarking.org and Phoronix Test Suite features -- this is not limited to just a certain Linux distribution or even Linux for that matter. As there is not anything similar for BSD, OpenSolaris, Windows, and Mac OS X operating systems, all of you are supported and welcome to join in too.
These heat-maps also have indicators at the 33rd and 66th percentiles as from there we break it down into different performance classes of low, mid, and high-end hardware. Again, it is all based upon real world data and is organically constructed out of all the community's data. There is also safeguards in place against outliers and anyone that may be trying to "game" the system. But regardless of what test(s) you run, besides the ability to let you select any results you wish to compare (read What OpenBenchmarking.org Is About for the features being announced ahead of its SCALE launch), you can also have this very efficient and effective overview to see how your system performs.
For example, the above graph from the Core i5 2500K results indicate that the Intel Sandy Bridge Linux graphics for the most part would be ranked as a mid-range system, but the Intel graphics are struggling in particular with the demanding GLSL tests. You are able to determine that very easily, and for those that wish, then you can use other OpenBenchmarking.org features for analyzing the results further and comparing the results directly against the matches that the OpenBenchmarking.org system finds as being relevant. You could almost look at it as crowd-sourced benchmarking and hardware/software testing on a mass scale.
That's not all that this OpenBenchmarking.org Performance Classification data is being used for but from there we can monitor the most common hardware/software components appearing in a performance class and by cross-referencing the data against the individual test profile's XML data to know what's being tested (e.g. CPU, GPU, network, RAM) we know the information to extract from the system's software and hardware report. From there, auto-generate a list of the most common occurrences and it's quickly become a performance index whether you're interested in a graphics card, motherboard, disk drive, or some other component. What is the percentile ranking difference between the same GPU on a closed and open-source driver? OpenBenchmarking.org can know that too. Again, more features not supported by Canonical's new hardware catalog.
Long story short, a set of new results was needed to verify the support working accordingly. So a day after running a large batch of graphics cards on open-source drivers through their paces to determine everything was going according to plan, here's the normal Phoronix Test Suite 3.0 results for you to look at before OpenBenchmarking.org becomes available. Those wanting to learn more should attend the Southern California Linux Expo presentation and read the other OpenBenchmarking.org and Iveland articles.
The system components remained the same as the Core i5 2500K testing with the same Sandy Bridge CPU clocked at 3.3GHz / 3.7GHz Turbo, Intel H67 motherboard, 2GB of DDR3 system memory, and an OCZ 60GB Vertex 2 SSD. The software was comprised of Ubuntu 10.10 with the Linux 2.6.38 kernel, GNOME 2.32.0, X.Org Server 1.9.3 RC1, Mesa 7.11-devel, xf86-video-ati 6.13.99, xf86-video-intel 2.14.0, and xf86-video-nouveau 0.0.16. No proprietary drivers were tested in this result set, but there are Catalyst results in yesterday's article. The graphics cards included a Radeon X800XL, Radeon X1800XT, Radeon HD 3650, Radeon HD 3850, Radeon HD 4550, Radeon HD 4650, Radeon HD 4830, Radeon HD 5450, and a Radeon HD 5750 on the ATI/AMD side. The NVIDIA side included a GeForce 9500GT, GeForce 9800GT, and GeForce GT 220. There were so many more Radeon graphics cards than NVIDIA GeForce graphics cards due to having more of them on hand, but also because the latest Nouveau driver code was being rather unstable except for select GPUs. There's also Gallium3D LLVMpipe results atop Sandy Bridge in this article, but a more focused article will be published next week that's centered on the LLVMpipe performance on the Intel Core i5 2500K.
The Phoronix Test Suite 3.0 tests included OpenArena, World of Padman, Warsow, Urban Terror, Tremulous, VDrift, and Lightsmark. As these results are fairly self-explanatory to anyone who regularly follows Phoronix to know about the on-going Linux driver developments (and so I can get back to the final PTS3/OpenBenchmarking.org development and interesting tests), enjoy them as you wish for reference against the open-source Mesa performance across this spectrum of hardware.