RFC: A Preview Of The Phoronix Graphs With Iveland

While you should read the article if you're at all interested in benchmarking or the performance testing done by Phoronix, here's the relevant section worth repeating:
While Phoronix.com and the development of the Phoronix Test Suite are handled by separate but linked entities, of interest to many Phoronix.com readers (and the other publications that leverage this software) will be the embeddable result graphs to be found on OpenBenchmarking.org and the improvements to be found within Iveland's pts_Graph library. There has long been a desire by some to have various statistical values and other technical metrics shown within the Phoronix Test Suite result graphs found on Phoronix.com and within the Phoronix Test Suite results viewer and other places.
This will happen with OpenBenchmarking.org as these embeddable graphs will be rendered in SVG / JavaScript within supported browsers (and automatically fallback to PNG/HTML in other browsers) to allow for exposing in real-time individual result values, system logs, and other data. These far more advanced graphs will also be found within the Phoronix Test Suite results viewer on the client side, which is also receiving other new features to be talked about later on in the Iveland development cycle. Any other individuals and publications can also use these OpenBenchmarking.org embeddable graphs, which should lead to the most transparent testing processes within the industry when paired with the Phoronix Test Suite client and other components.
Starting last night and continuing through today, I have pushed the first bits of the pts_Graph overhaul into the Phoronix Test Suite Git code-base. This code is just the beginning of what's to come as far as graphing is concerned and being far from feature-complete yet for Phoronix Test Suite Iveland, which will be released in Q1'2011. However, as what's committed is already a major change visually from the existing PTS1/PTS2 graphs, here's a preview of these graphs.
While the graphs will be displayed in SVG/JavaScript with a number of rich and interactive capabilities when embedded from OpenBenchmarking.org, this part is not complete yet and just the static PNGs are embedded into this posting.
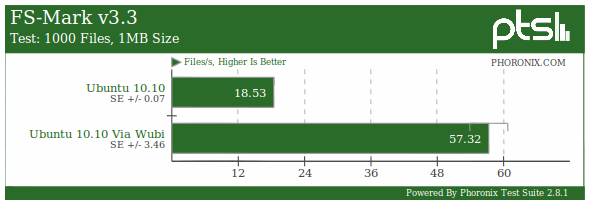
As you can see already from the static version, the graphs are radically different from what you will find with pre-Iveland versions of the Phoronix Test Suite. For comparison, below is the same graph rendered by Phoronix Test Suite 2.8; it's from this week's Ubuntu Wubi benchmarks review.

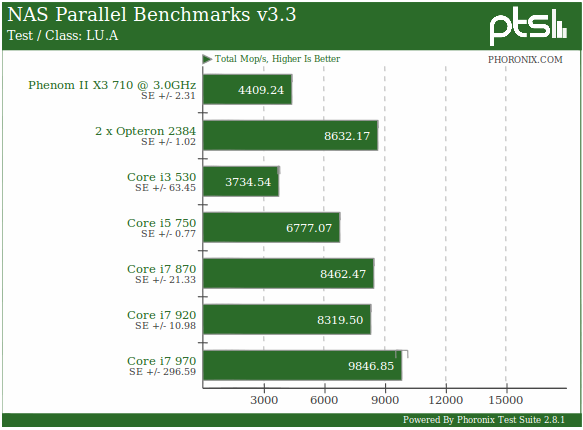
The Phoronix Test Suite 3.0 graphing library adds support for horizontal bars (support for vertical bar graphs remains and can be toggled from the ~/.phoronix-test-suite/graph-config.xml along with a legacy mode). Sure to please some is also the addition of error bars being added to the bar graphs. The next two graphs are from an upcoming Intel Core i7 970 "Gulftown" Linux review, courtesy of Intel's support.
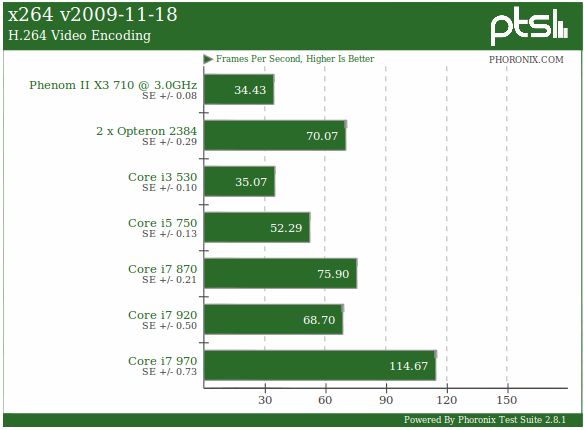
Error bars are automatically generated on relevant tests and they are the set of lines appearing on the top edge of each bar. On some graphs though it's hard to see them, as the Phoronix Test Suite already goes through a number of steps in ensuring statistical significance (and more features are to come with PTS Iveland). The standard error is also currently reported under each of the tests. Once the new pts_Graph library is finished and integrated with OpenBenchmarking.org, such information will be displayed on mouse-overs, etc.
Again, these new graphs are only the beginning and should be considered pre-alpha as they are far from being feature complete where I intend to have them at for Phoronix Test Suite 3.0 final. However, as it's already an improvement over the existing graphs, the new renderer may begin to be used at Phoronix.com in as soon as next week.
We welcome your feedback on these new graphs whether you have comments on the aesthetics or other features you would like to see. Some of the features coming down the pipe for the SVG/JavaScript version is mousing over for various information and effects (standard deviation, standard error, individual test run values, etc), various click elements leading you back to data on OpenBenchmarking.org (system logs, test run logs, etc), alternate views (i.e. switching in real-time to viewing the results in a table form), compare your system's performance with the Phoronix Test Suite to a particular graph's results very easily, and a more polished UI. The line graphs and other graph types will also begin taking advantage of these new pts_Graph library features soon. These features are just not for us, but all users of the Phoronix Test Suite, even other competing publications are able to generate such graphs configured to their needs.
You can provide any feedback on these graphs by commenting in this forum thread (Update: There's also more graph examples and information in that thread's ongoing discussion) or emailing us.
43 Comments