
 Tweet
Tweet
( From the mailing list: http://phoronix-test-suite.com/piper...ay/000008.html )
Committed to master this morning is initial support for abstract results generated by tests within the Phoronix Test Suite. The Phoronix Test Suite is no longer limited to test that provide numerical results. Changes have been made to both the Phoronix Test Suite and pts_Graph in supporting abstract data types, but there shouldn't be any regressions.
The first type that's now fully implemented is for tests that are measured on a pass / fail basis. For these tests, a pts_PassFailGraph object has been added for graphically showing the results (see example screenshot of the PTS Results Viewer). To implement this type, the only change needed on the behalf of the test maintainer is to add a <ResultType> tag within the <TestInformation> tag that contains the value of PASS_FAIL. If it hasn't been clear, the other currently supported result types are BAR_GRAPH and LINE_GRAPH, if you would like the PTS Results Viewer to use a bar or line graph, respectively. If <ResultType> is invalid or not defined, bar graph is the default. For tests relying on a pass / fail setup, the parse-results script just needs to print a boolean if it passed or a PASS / FAIL string. Right now there are no tests within Phoronix Test Suite relying upon this new result type, however.
If there are any other abstract types you would like to see supported, let us know. It's quite simple in fact supporting abstract types within the results viewer with the latest pts_Graph git code (pts_PassFailGraph is only around 80 lines of code). Only minimal changes are needed within pts-core for supporting the new types.
With this latest support, I am not actually too far from offering a result type of a (JPG/PNG) screenshot, for tests that would be good for an image quality comparison, and then rendering a portion of the screenshot from each result side-by-side within PTS Results Viewer. The only blockers for that is then the results XML profile relying upon external (JPG/PNG) file(s), which wouldn't make it too feasible at this time for PTS Global (due to the increased bandwidth / disk space needs).
Example Pass/Fail Screenshot:
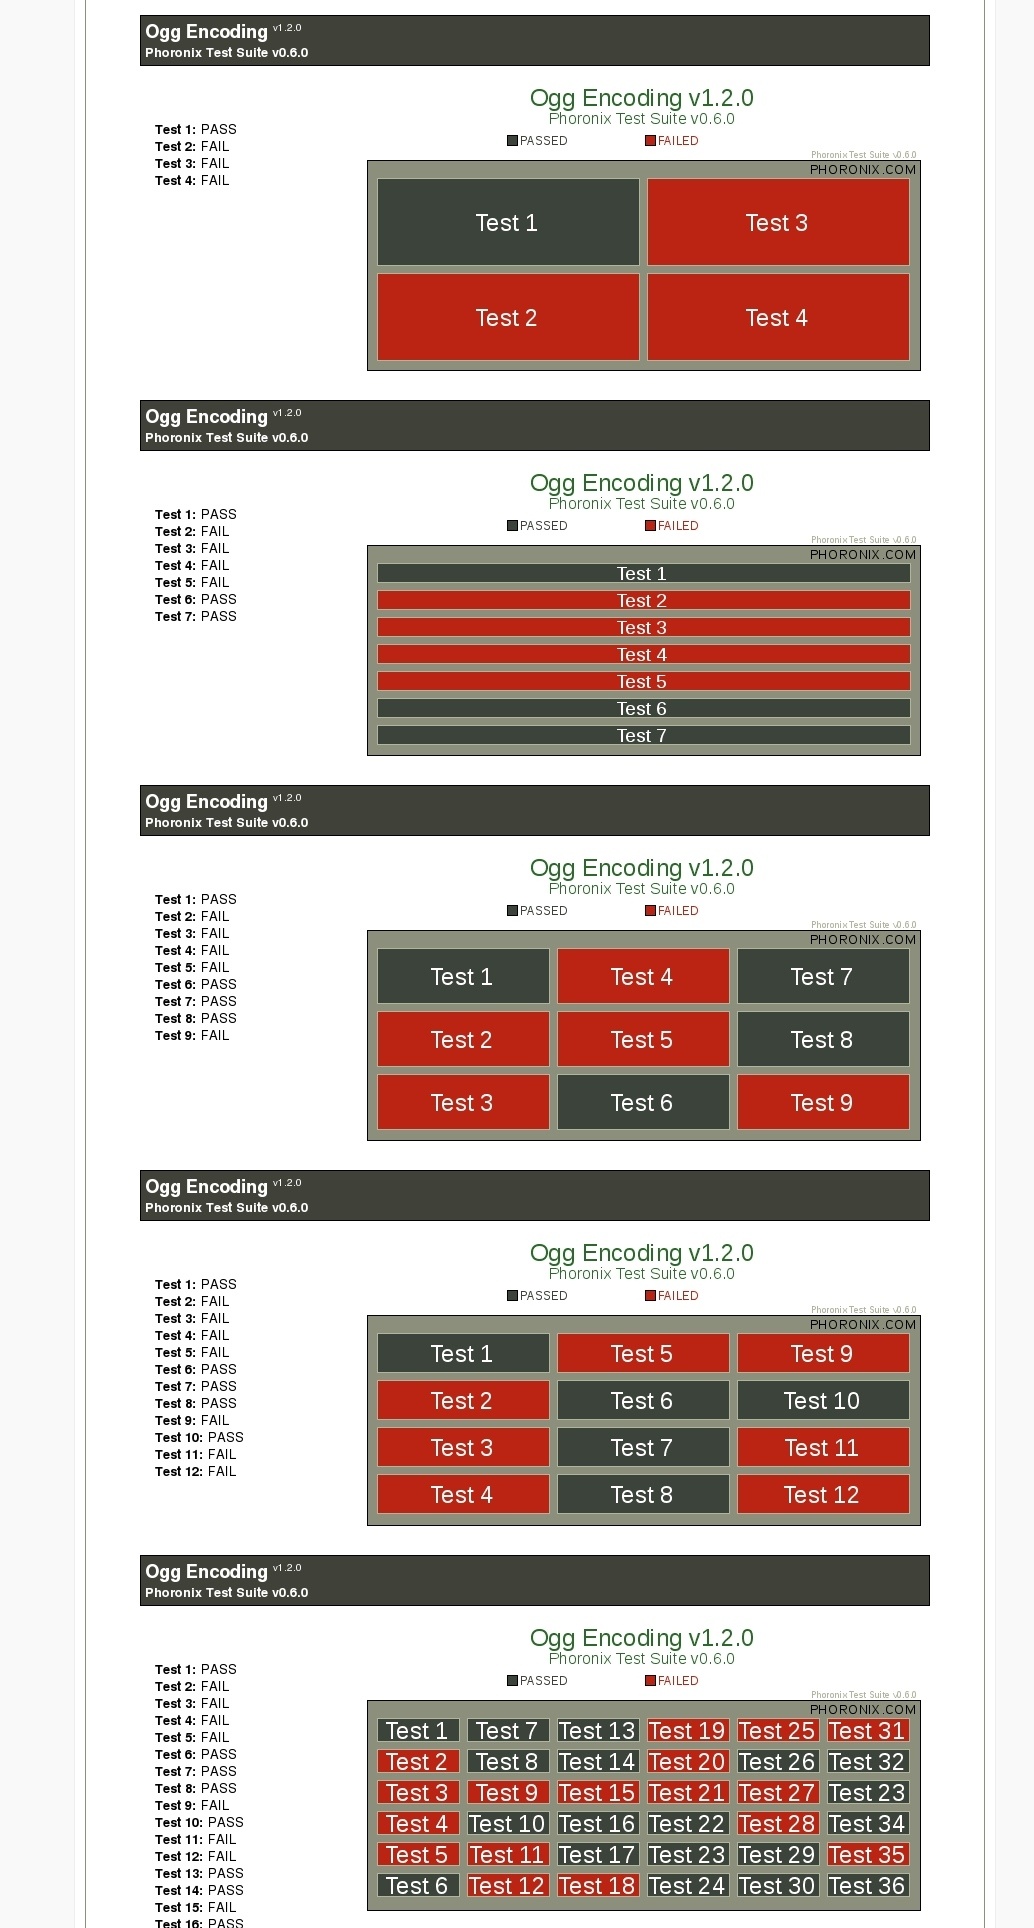
(as you can see, it also has no problems scaling)
Michael
Committed to master this morning is initial support for abstract results generated by tests within the Phoronix Test Suite. The Phoronix Test Suite is no longer limited to test that provide numerical results. Changes have been made to both the Phoronix Test Suite and pts_Graph in supporting abstract data types, but there shouldn't be any regressions.
The first type that's now fully implemented is for tests that are measured on a pass / fail basis. For these tests, a pts_PassFailGraph object has been added for graphically showing the results (see example screenshot of the PTS Results Viewer). To implement this type, the only change needed on the behalf of the test maintainer is to add a <ResultType> tag within the <TestInformation> tag that contains the value of PASS_FAIL. If it hasn't been clear, the other currently supported result types are BAR_GRAPH and LINE_GRAPH, if you would like the PTS Results Viewer to use a bar or line graph, respectively. If <ResultType> is invalid or not defined, bar graph is the default. For tests relying on a pass / fail setup, the parse-results script just needs to print a boolean if it passed or a PASS / FAIL string. Right now there are no tests within Phoronix Test Suite relying upon this new result type, however.
If there are any other abstract types you would like to see supported, let us know. It's quite simple in fact supporting abstract types within the results viewer with the latest pts_Graph git code (pts_PassFailGraph is only around 80 lines of code). Only minimal changes are needed within pts-core for supporting the new types.
With this latest support, I am not actually too far from offering a result type of a (JPG/PNG) screenshot, for tests that would be good for an image quality comparison, and then rendering a portion of the screenshot from each result side-by-side within PTS Results Viewer. The only blockers for that is then the results XML profile relying upon external (JPG/PNG) file(s), which wouldn't make it too feasible at this time for PTS Global (due to the increased bandwidth / disk space needs).
Example Pass/Fail Screenshot:
(as you can see, it also has no problems scaling)
Michael
Comment